Regional Crash Data
Analyzing Crashes in Our Region
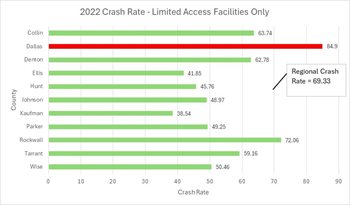
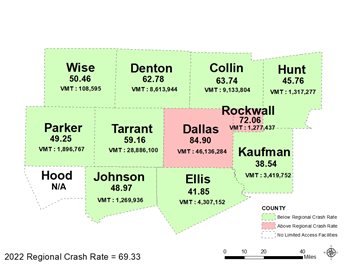
The NCTCOG Safety Program annually calculates county level crash rates on limited access facilities for the NCTCOG 12-County Metropolitan Planning Area (MPA). County Level Crash Rate Maps display crash rates by county in comparison to the regional crash rate for that year. Counties that have a higher crash rate than the regional rate are shown in red, while counties with a rate below the regional crash rate are shown in green.
 |
 |
Crash Contributing Factors
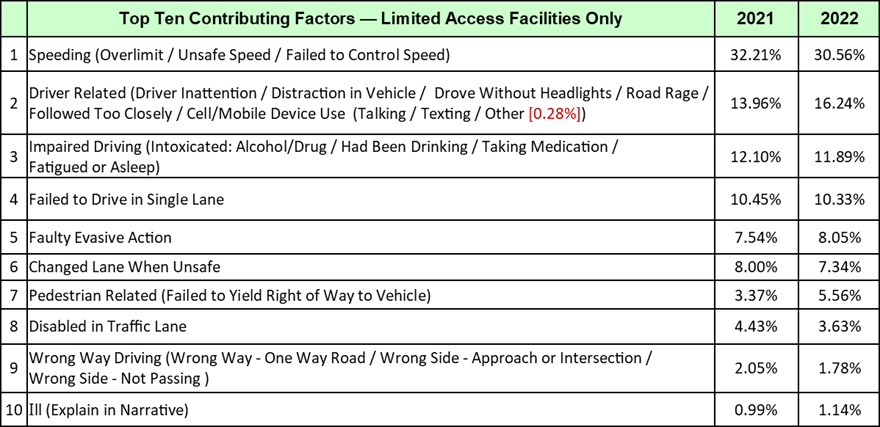
The Contributing Factor Analysis is done each year for serious injury and fatality crashes and includes Primary, Secondary, and Tertiary Contributing Factors on limited access facilities in NCTCOG's 12-county MPA.
2022 Top 10 Contributing Factors - Limited Access Facilities Only
Previous Years' Contributing Factors
| Contributing Factors | Percentage | |
|---|---|---|
| 1 | Speeding - (Overlimit/Unsafe Speed/Failed to Control Speed) | 32.21% |
| 2 | Driver Related (Distraction in Vehicle/Driver Inattention/Road Rage/Drove Without Headlights/ Cell/Mobile Device Use - (Talking/Texting/Other / Unknown) [0.53%]) |
13.96% |
| 3 | Impaired Driving (under Influence: Had Been Drinking, Alcohol, Drug / Taking Medication / Fatigued or Asleep | 12.10% |
| 4 | Faild to Drive in Single Lane | 10.45% |
| 5 | Changed Lane when Unsafe | 8.00% |
| 6 | Faulty Evasive Action | 7.54% |
| 7 | Disabled/Parked in Traffic Lane | 4.43% |
| 8 | Pedestrian Failed to Yield Righ of Way to Vehicle | 3.37% |
| 9 | Wrong Way Driving (Wrong Way-One Way Road / Wrong Side-Not Passing) | 2.05% |
| 10 | Turned When Unsafe | 1.19% |
2020 TOP TEN CONTRIBUTING FACTORS - LIMITED ACCESS FACILITIES ONLY
| Contributing Factors | Percentage | |
|---|---|---|
| 1 | Speeding - (Overlimit/Unsafe Speed/Failed to Control Speed) | 33.04% |
| 2 | Failed to Drive in Single Lane | 11.99% |
| 3 | Driver Related (Distraction in Vehicle/Driver Inattention/Road Rage/Drove Without Headlights/ Cell/Mobile Device Use - (Talking/Texting/Other/Unknown) [0.53%]) |
9.86% |
| 4 | Under Influence (Had been Drinking / Alcohol /Drug) | 9.41% |
| 5 | Changed Lane when Unsafe | 8.35% |
| 6 | Faulty Evasive Action | 7.10% |
| 7 | Pedestrian Failed to Yield Right of Way to Vehicle | 5.60% |
| 8 | Followed too Closely | 5.24% |
| 9 | Disabled in Traffic Lane | 2.93% |
| 10 | Fatigued or Asleep | 1.42% |
2019 TOP TEN CONTRIBUTING FACTORS - LIMITED ACCESS FACILITIES ONLY
Cell/Mobile Device Use - (Talking/Texting/Other/Unknown) [0.53%])
| Contributing Factors | Percentage | |
|---|---|---|
| 1 | Speeding - (Overlimit/Unsafe Speed/Failed to Control Speed) | 34.23% |
| 2 | Driver Related (Distraction in Vehicle/Driver Inattention/Road Rage/Drove Without Headlights/ Cell or Mobile Device Use - (Talking/Texting/Other/Unknown) [0.53%]) |
11.41% |
| 3 | Changed Lane when Unsafe | 11.31% |
| 4 | Faulty Evasive Action | 9.49% |
| 5 | Following too Closely | 8.72% |
| 6 | Failed to Drive in Single Lane | 8.26% |
| 7 | Under Influence (Had been Drinking / Alcohol /Drug) | 5.61% |
| 8 | Fatigued or Asleep | 2.16% |
| 9 | Disabled in Traffic Lane | 1.79% |
| 10 | Pedestrian Failed to Yield Right of Way to Vehicle | 1.26% |
| Contributing Factors | Percentage | |
|---|---|---|
| 1 | Speeding - (Overlimit/Unsafe Speed/Failed to Control Speed) | 33.15% |
| 2 | Failed to Drive in Single Lane | 10.44% |
| 3 | Driver Related (Distraction in Vehicle/Driver Inattention/Road Rage/Drove Without Headlights/ Cell or Mobile Device Use - (Talking/Texting/Other/Unknown) [0.07%]) |
10.24% |
| 4 | Under Influence (Had been Drinking / Alcohol /Drug) | 9.10% |
| 5 | Faulty Evasive Action | 7.88% |
| 6 | Changed Lanes when Unsafe | 6.81% |
| 7 | Following too Closely | 3.98% |
| 8 | Pedestrian - Failed to Yield ROW to Vehicle | 3.71% |
| 9 | Disabled in Traffic Lane | 2.36% |
| 10 | Fatigued or Asleep | 2.09% |
| Contributing Factors | Percentage | |
|---|---|---|
| 1 | Speeding - (Overlimit/Unsafe Speed/Failed to Control Speed) | 34.63% |
| 2 | Changed Lanes when Unsafe | 13.02% |
| 3 | Driver Related (Distraction in Vehicle/Driver Inattention/Road Rage/Drove Without Headlights/ Cell or Mobile Device Use - (Talking/Texting/Other/Unknown) [0.68%]) |
12.23% |
| 4 | Following too Closely | 10.83% |
| 5 | Faulty Evasive Action | 7.09% |
| 6 | Failed to Drive in Single Lane | 6.95% |
| 7 | Under Influence (Had been Drinking/Alcohol/Drug) | 3.19% |
| 8 | Failed to Yield ROW (To Pedestrian/Turning Left/Yield Sign) | 2.79% |
| 9 | Fatigued or Asleep | 1.50% |
| 10 | Turned Improperly (Cut Corner on Left/Wide Right/Wrong Lane) | 1.13% |
| Contributing Factors | Percentage | |
|---|---|---|
| 1 | Speeding - (Overlimit/Unsafe Speed/Failed to Control Speed) | 32.10% |
| 2 | Driver Related (Distraction in Vehicle/Driver Inattention/Drove Without Headlights/Road Rage) | 11.56% |
| 3 | Faulty Evasive Action | 9.68% |
| 4 | Changed Lanes when Unsafe | 8.75% |
| 5 | Following too Closely | 8.36% |
| 6 | Failed to Drive in Single Lane | 6.59% |
| 7 | Under Influence (Had been Drinking/Alcohol/Drug) | 4.57% |
| 8 | Disabled in Traffic Lane | 2.24% |
| 9 | Fatigued or Asleep | 1.94% |
| 10 | Sick or Ill (Explain in Narrative) | 1.01% |