Current Ozone Activity
Ozone season Trendline Current Design Value is: 75 ppb

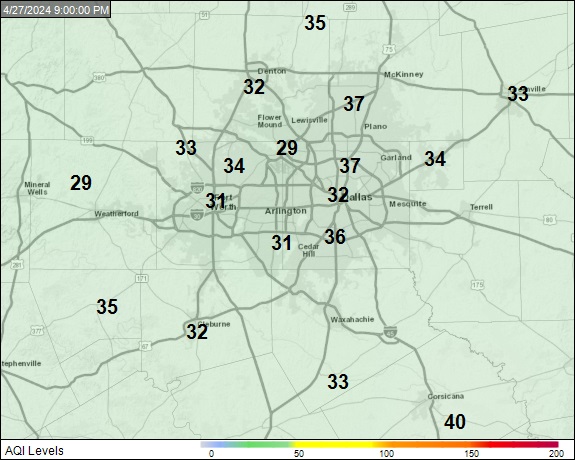
Current Air Quality Index (AQI) MapThese are not monitor values. These are AQI values. See table below. |
%>) |

|
|
| Air Quality Index(AQI) Values | 8-hour Ozone Levels (ppb) | Levels of Health Concern | Colors |
|---|---|---|---|
| 0-50 | 0-54 | Good | Green |
| 51-100 | 55-70 | Moderate | Yellow |
| 101-150 | 71-85 | Unhealthy for Sensitive Groups | Orange |
| 151 to 200 | 86-105 | Unhealthy | Red |
| 201 to 300 | 106-200 | Very Unhealthy | Purple |
| 301 to 500+ | Not Defined | Hazardous | Maroon |
Current AQI Animation Animation Courtesy of AirNow
Monitor values shown on map are AQI values, not hourly ozone measurements. See AQI table above.
 |
|
|
|
|
Please contact Jenny Narvaez with any questions.

