TOD Insights

NCTCOG's transit-oriented development (TOD) insights provide data analysis for the rail station areas in the Dallas-Fort Worth (DFW) region, including the Dallas Area Rapid Transit (DART), Denton County Transportation Authority (DCTA), and Trinity Metro networks. The goal of these insights is to assist cities, transit agencies, and other stakeholders in assessing TOD potential and implementation.

Read the Report View the Appendices
Purpose of the Report
The North Texas Regional TOD Progress Report takes key issues highlighted in Regional Transit 2.0 and applies a data driven evaluation of North Texas’ TOD areas. The progress report is intended to provide city and regional stakeholders with insights into the status of TOD in North Texas, using the most recent available data. By providing data driven targets for shared regional TOD implementation, North Texas can continue to advance TOD efforts to address regional growth
TOD Data Measures
The progress report TOD measures focus on three overarching categories: Performance, Informative, and Action. Each category consists of multiple measures. The report strategically shows through these categories the TOD progress, some context, and where the region needs to advance in each key area.
Category | Measure |
Performance Measures: Show outcomes. Goal is to increase these measures. | Economic Development |
Walking in Station Area | |
Rail Ridership | |
Informative Measures: Provide context and may influence performance measures. | Demographics |
Land Use | |
Transit Trip Purposes & Destinations | |
Action Measures: Items local governments can directly implement. | Sidewalks & Bicycle Connectivity |
Station Area TOD Planning & Zoning | |
Incentives/Partnerships with Private Sector |
Interactive TOD Progress Report Map
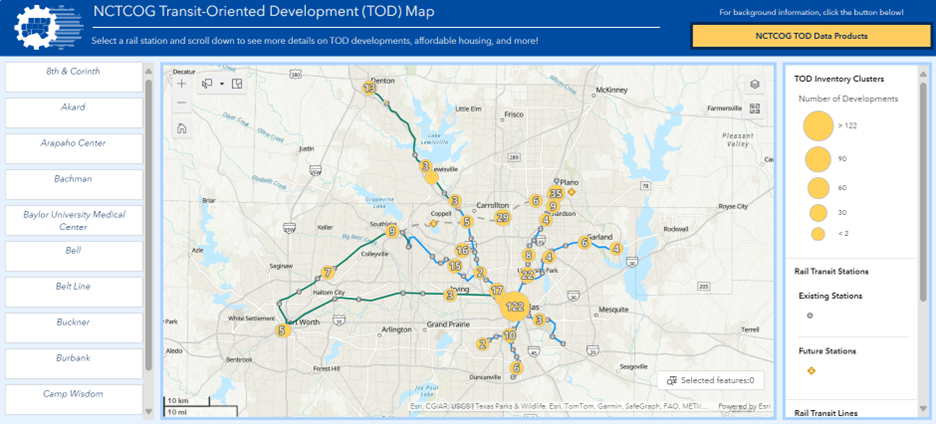
North Texas TOD Inventory
The TOD Inventory is a property-based identification of TODs in the DFW region available in the interactive map below. It shows the best examples and trends in TOD construction. The methods to identify and evaluate TODs and a complete list of TODs are available in the summary document. The map also includes historic Walkable TOD Districts.
TOD Fact Sheets
Rail Station Area Fact Sheets provide a brief overview of the demographic, transit service, planning, development data, and existing and planned pedestrian and bicycle facilities within a half-mile distance of each light rail and commuter rail station in the DFW region. Data provided in the fact sheets are products of NCTCOG’s TOD Data Collection efforts and the Active Transportation Routes to Rail study. Rail stations are organized by city.
- Full Fact Sheets: Fact Sheets on Land Use, TOD, and Pedestrian and Bicycle Routes to Rail (6 pages).
- Bicycle & Pedestrian Routes to Rail: Fact Sheets on pedestrian and bicycle facilities around rail stations (2 pages).
- Transit Agency: Transit schedule information (external website).
Fact Sheet Guide [PDF]: A guide to the data and analysis methodology for the TOD Fact Sheets.
|
Station Name |
1 Full Fact Sheets |
2 Pedestrian & Bicycle |
3 Transit Agency |
|
8th & Corinth |
PDF 8 MB |
PDF 4 MB |
|
|
Akard Station |
PDF 17 MB |
PDF 12 MB |
|
|
Bachman Station |
PDF 8 MB |
PDF 4 MB |
|
|
Baylor University Medical Center Station |
PDF 11 MB |
PDF 7 MB |
|
|
Buckner Station |
PDF 8 MB |
PDF 4 MB |
|
|
Burbank Station |
PDF 8 MB |
PDF 4 MB |
|
|
Camp Wisdom Station |
PDF 9 MB |
PDF 5 MB |
|
|
Cedars Station |
PDF 10 MB |
PDF 5 MB |
|
|
Cityplace/Uptown Station |
PDF 9 MB |
PDF 4 MB |
|
|
Convention Center Station |
PDF 14 MB |
PDF 9 MB |
|
|
Dallas Zoo Station |
PDF 9 MB |
PDF 4 MB |
|
|
Deep Ellum Station |
PDF 13 KB |
PDF 8 MB |
|
|
Fair Park Station |
PDF 9 MB |
PDF 5 MB |
|
|
Forest Lane Station |
PDF 8 MB |
PDF 5 MB |
|
|
Hampton Station |
PDF 7 MB |
PDF 4 MB |
|
|
Hatcher Station |
PDF 7 MB |
PDF 4 MB |
|
|
Illinois Station |
PDF 6 MB |
PDF 4 MB |
|
|
Inwood/Love Field Station |
PDF 7 MB |
PDF 4 MB |
|
|
Kiest Station |
PDF 7 MB |
PDF 4 MB |
|
|
Lake Highlands Station |
PDF 7 MB |
PDF 4 MB |
|
|
Lake June Station |
PDF 6 MB |
PDF 4 MB |
|
|
Lawnview Station |
PDF 6 MB |
PDF 4 MB |
|
|
LBJ/Central Station |
PDF 6 MB |
PDF 4 MB |
|
|
LBJ/Skillman Station |
PDF 6 MB |
PDF 4 MB |
|
|
Ledbetter Station |
PDF 6 MB |
PDF 4 MB |
|
|
Lovers Lane Station |
PDF 7 MB |
PDF 4 MB |
|
|
Market Center Station |
PDF 6 MB |
PDF 4 MB |
|
|
Medical/Market Center Station |
PDF 6 MB |
PDF 4 MB |
|
|
MLK, Jr. Station |
PDF 7 MB |
PDF 5 MB |
|
|
Mockingbird Station |
PDF 7 MB |
PDF 4 MB |
|
|
Morrell Station |
PDF 7 MB |
PDF 4 MB |
|
|
Park Lane Station |
PDF 7 MB |
PDF 4 MB |
|
|
Pearl Station |
PDF 12 MB |
PDF 9 MB |
|
|
Royal Lane Station |
PDF 6 MB |
PDF 4 MB |
|
|
Southwestern Medical District/Parkland Station |
PDF 7 MB |
PDF 4 MB |
|
|
St. Paul Station |
PDF 12 MB |
PDF 10 MB |
|
|
Tyler/Vernon Station |
PDF 6 MB |
PDF 4 MB |
|
|
Union Station |
PDF 12 MB |
PDF 10 MB |
|
|
UNT Dallas Station |
PDF 7 MB |
PDF 4 MB |
|
|
VA Medical Center Station |
PDF 7 MB |
PDF 4 MB |
|
|
Victory Station |
PDF 9 MB |
PDF 6 MB |
|
|
Walnut Hill Station |
PDF 7 MB |
PDF 4 MB |
|
|
Walnut Hill/Denton Station |
PDF 6 MB |
PDF 4 MB |
|
|
West End Station |
PDF 14 MB |
PDF 11 MB |
|
|
Westmoreland Station |
PDF 6 MB |
PDF 4 MB |
|
|
White Rock Station |
PDF 6 MB |
PDF 4 MB |
|
Station Name |
1 Full Fact Sheets |
2 Pedestrian & Bicycle |
3 Transit Agency |
|
Bell Station |
PDF 7 MB |
PDF 3 MB |
|
|
CentrePort/DFW Airport Station |
PDF 7 MB |
PDF 3 MB |
|
|
Fort Worth Central Station |
PDF 6 MB |
PDF 3 MB |
|
|
Mercantile Center Station |
PDF 5 MB |
PDF 3 MB |
|
|
North Side Station |
PDF 7 MB |
PDF 5 MB |
|
|
Texas & Pacific Station |
PDF 5 MB |
PDF 3 MB |
|
Station Name |
1 Full Fact Sheets |
2 Pedestrian & Bicycle |
3 Transit Agency |
|
Belt Line Station |
PDF 8 MB |
PDF 3 MB |
|
|
Downtown Irving/Heritage Crossing |
PDF 8 MB |
PDF 4 MB |
|
|
Irving Convention Center Station |
PDF 6 MB |
PDF 4 MB |
|
|
Las Colinas Urban Center Station |
PDF 6 MB |
PDF 4 MB |
|
|
North Lake College Station |
PDF 6 MB |
PDF 4 MB |
|
|
University of Dallas Station |
PDF 6 MB |
PDF 3 MB |
|
|
West Irving Station |
PDF 6 MB |
PDF 4 MB |
Staff: Travis Liska