
TOD Insights
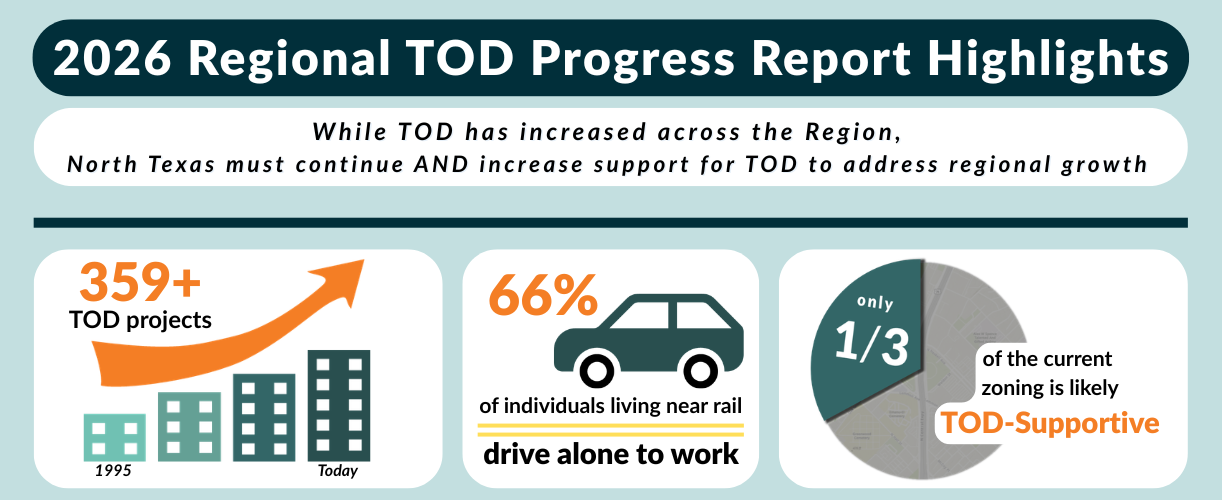
NCTCOG's transit-oriented development (TOD) insights provide data analysis for the rail station areas in the Dallas-Fort Worth (DFW) region, including the Dallas Area Rapid Transit (DART), Denton County Transportation Authority (DCTA), and Trinity Metro networks. The goal of these insights is to assist cities, transit agencies, and other stakeholders in assessing TOD potential and implementation.
Read the Report View the Appendices
Purpose of the Report
The North Texas Regional TOD Progress Report takes key issues highlighted in Regional Transit 2.0 and applies a data driven evaluation of North Texas’ TOD areas. The progress report is intended to provide city and regional stakeholders with insights into the status of TOD in North Texas, using the most recent available data. By providing data driven targets for shared regional TOD implementation, North Texas can continue to advance TOD efforts to address regional growth
TOD Data Measures
The progress report TOD measures focus on three overarching categories: Performance, Informative, and Action. Each category consists of multiple measures. The report strategically shows through these categories the TOD progress, some context, and where the region needs to advance in each key area.
Category | Measure |
Performance Measures: Show outcomes. Goal is to increase these measures. | Economic Development |
Walking in Station Area | |
Rail Ridership | |
Informative Measures: Provide context and may influence performance measures. | Demographics |
Land Use | |
Transit Trip Purposes & Destinations | |
Action Measures: Items local governments can directly implement. | Sidewalks & Bicycle Connectivity |
Station Area TOD Planning & Zoning | |
Incentives/Partnerships with Private Sector |
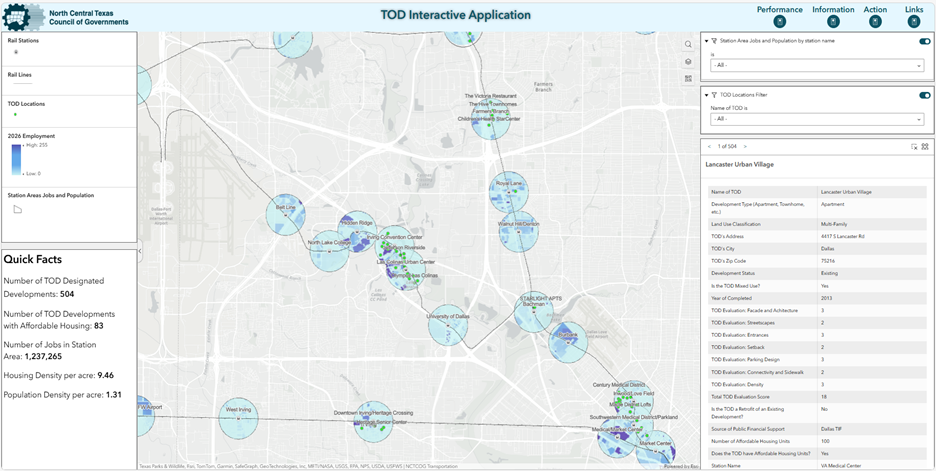
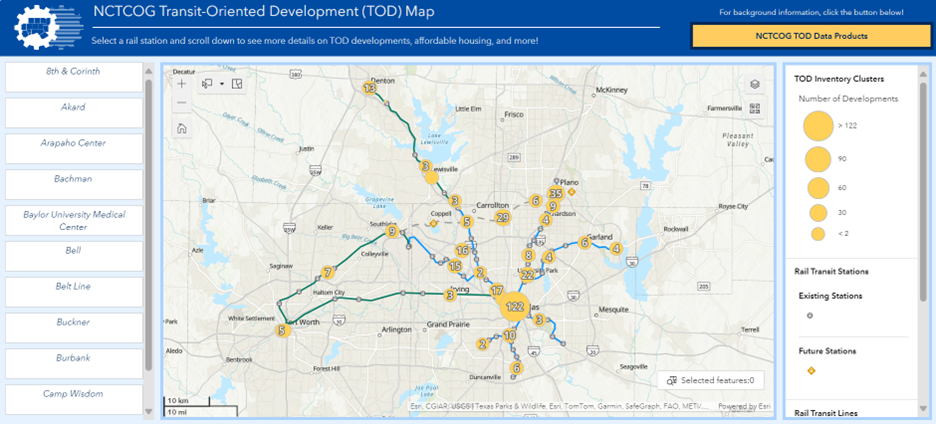
The TOD Inventory is a property-based identification of TODs in the DFW region available in the interactive map below. It shows the best examples and trends in TOD construction. The methods to identify and evaluate TODs and a complete list of TODs are available in the summary document. The map also includes historic Walkable TOD Districts.
TOD Inventory Key Insights from 2024 Update
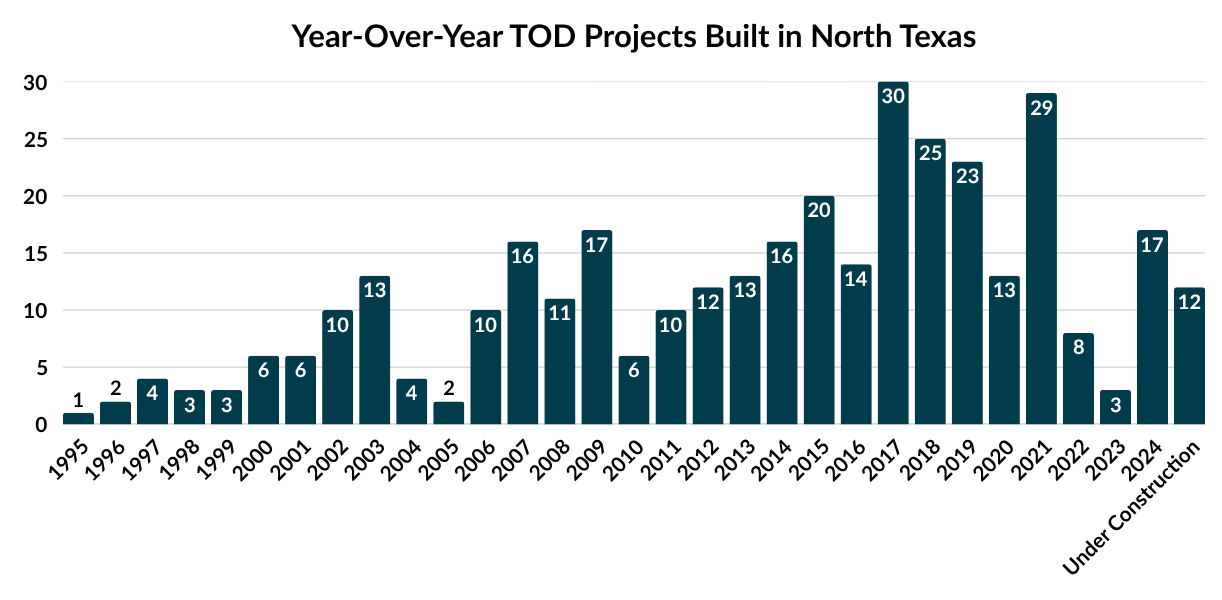
The number of completed TODs has steadily increased since 1995 as the rail transit system in North Texas has expanded. However, these TODs are unevenly distributed across the region’s rail stations with ¼ of the stations having no TOD.
Notable Examples of “Ideal” TOD Design
Developments included in the inventory were scored for how well they met the “ideal” TOD criteria on a scale of 3 to 1. “Ideal” TOD criteria were developed from a summary of national transit-oriented and pedestrian-oriented design guidelines. All seven criterion scores were totaled to provide a “TOD Score” where a score of 21 would indicate a development meeting the national criteria definition.

Mustang Station photo courtesy of DART. Additional imagery by NCTCOG staff.
Staff: Travis Liska