Storm Shifting
 Upper Trinity Storm Shifting
The Upper Trinity River Silver Jackets Storm Shifting Project is intended to contribute to the viability of community resiliency and flood hazard mitigation strategies. This is accomplished by shifting historical storms over nearby locations to generate compelling real-world examples of flood risk that can be compared against hypothetical estimates such as 100-year and 500-year floodplain maps. Through key partnerships, statistically significant storms from North Texas were selected and moved over areas of interest using the process of storm shifting.
Current flood mapping products perpetuate a misconception that flooding stops at the lines on a map. This “in or out” misconception can be explained in part by the limited flood scenarios and lack of historic data contributing to flood map development. Determining a more complete picture of flood risk and filling in these information gaps requires a different strategy. Storm shifting is that strategy, providing informative, relatable, and non-regulatory data to help communities better understand their own flood risk and further empower them to mitigate disastrous effects.
View Final Report View Fact Sheet
Modeling Approach
A total of five historic storms, ranging from approximately 100-year to 1000-year events, were selected for shifting, or ‘transposition’. The historical storms were then transposed to an optimized location that maximizes peak flow and flood extents at the downstream area of interest. Three hydrologic scenarios were simulated to account for variability within the watershed due to seasonal and other effects: dry (drought-type), best (most likely) estimate, and wet (soils are saturated and lakes are full).
Results
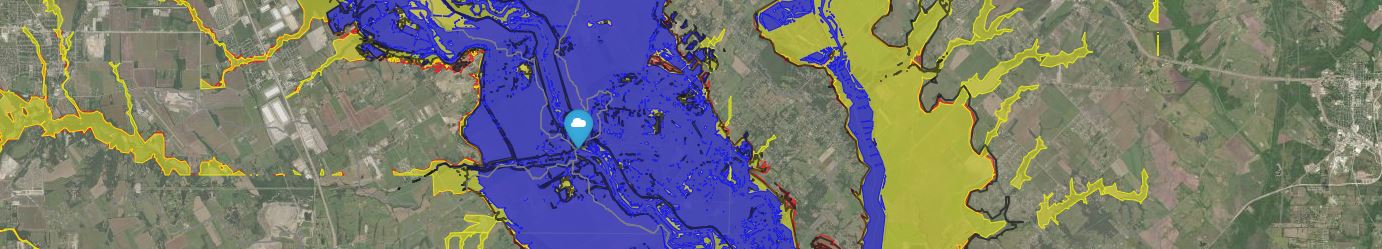
For each hydraulic model simulation, the resulting flood extent, or ‘inundation’ boundary from the storm shifting analysis (blue) were plotted against recently published FEMA preliminary 100-year and 500-year inundation boundaries (yellow and red) in the examples to the right. In general, the shifted 100-year storm events show inundation results similar to the FEMA preliminary 100-year inundations. However, comparison of the three different hydrologic scenarios show noticeable differences in inundated areas and underscores how much variability exists in rainfall-runoff flood modeling. The takeaway is that the same storm event can result in vastly different impacts, depending on the initial hydrologic condition of the watershed.
Application
Data from this study is available for download at the link below and includes a full report and interactive HTML maps for all the selected storms and areas of interest. Flood layers can be toggled on/off in the upper right corner of the map, and additional peak flood timing and stage (stream elevation) information is viewed by clicking the point of interest icon (see example below). These features provide emergency managers with another valuable tool in the development of disaster response and emergency plans.
Storm Shift Study Overview Download GIS Data Dallas County Study Locations
Interactive Inundation Maps
Note: pages are large and may take a minute to load.- 2000 Joshua_Abv10miCk
- 2000 Joshua_EastFkAbvMustangCk
- 2000 Joshua_ElmFkJ070
- 2000 Joshua_WestFk+ElmFk
- 2000 Joshua_Wycliff
- 2004 Mansfield_Abv10miCk
- 2004 Mansfield_EastFkAbvMustangCk
- 2004 Mansfield_ElmFkJ070
- 2004 Mansfield_WestFk+ElmFk
- 2004 Mansfield_Wycliff
- 2010 TS_Hermine_Abv10miCk
- 2010 TS_Hermine_EastFkAbvMustangCk
- 2010 TS_Hermine_ElmFkJ070
- 2010 TS_Hermine_WestFk+ElmFk
- 2010 TS_Hermine_Wycliff
- 2015 TS_Bill_Abv10miCk
- 2015 TS_Bill_EastFkAbvMustangCk
- 2015 TS_Bill_ElmFkJ070
- 2015 TS_Bill_WestFk+ElmFk
- 2015 TS_Bill_Wycliff
- 2015 TS_Patricia_Abv10miCk
- 2015 TS_Patricia_EastFkAbvMustangCk
- 2015 TS_Patricia_ElmFkJ070
- 2015 TS_Patricia_WestFk+ElmFk
- 2015 TS_Patricia_Wycliff
Partners
USACE
USACE Silver Jackets
Dallas County
TXGLO
FEMA
NCTCOG